
As business owners, you want to understand the financial implications of all decisions you make throughout your business. You may want to consider economic trade-offs that get you ahead faster, for example.
The best way to do it is through financial analysis tools. These are the analytical techniques to evaluate and interpret financial statements. Financial analysis helps business owners plan their course of action, find the best investments or assess performance.
In other words, inspecting the numbers could identify problems or reveal opportunities for the business. Either entry points to save money or prop up the company for sales growth. Moreover, you can gauge a business’s health and its competitive standing.
Some of the frequently used financial analysis tools are:
- Common size statement, a.k.a. vertical analysis
- Comparative financial statements or the comparison of a business’s financial statements
- Ratio analysis or quantitative analysis
- Cash flow analysis
- Trend analysis
Every financial tool for analysis contributes to interpreting the answers you’re looking for. Therefore learning the differences and choosing the proper tool among the set of alternatives is imperative.
Here, you’ll discover everything you need to know about the top financial analysis tools you can use for your business. Keep reading to learn more.
Who uses financial statements?
Companies don’t only prepare and analyze financial statements for themselves. Different categories of people and corporations use financial statements to make sense of information that is relevant to them.
For this reason, financial statements and their analytic interpretations are prepared with a target audience in mind. That is where financial analysis and financial analysis tools come in.
The most frequent users of financial statements are indicated below:
- Management
The foremost users of financial statements are the managing bodies of the business. They need financial statements to make informed decisions on company operations. This financial analysis will enable them to operate the business effectively daily.
- Investors
Investors use financial statements to determine the value and financial health of a company. Once purchased, investors monitor financial statements to determine how well their investment is doing.
- Creditors
Creditors are interested in financial statements to ascertain if a company can repay its debts. That includes bonds, loans, leases, trade credit, and lines of credit.
- Government
The government uses financial statements to monitor compliance with tax laws. They are also interested in a company’s ability to make interest and tax payments on time.
- Analysts
Market analysts have a good foundational knowledge of the industry. They use financial statements and financial analysis tools to determine whether businesses are suitable for investments or not.
Many entities depend on the accuracy of your financial statements, including customers and employees. That’s why a good command of financial statements is essential on top of employing the proper financial analysis tools. If you need a hand with this one, Wizard of Sales® can help you. Book a call.

4 Most Common Financial Analysis Tools
As a business owner, you need to understand your financial situation clearly. That will allow you to make sound business decisions that will result in profitability. External stakeholders will also use your financial standing to shape their choices concerning your business.
Financial analysis tools will help you do just that. Here are the four most common financial analysis tools you can employ. With these, you’ll know better where your business stands and how you go from there.
Common Size Statement
The common size statement is one of the most basic financial analysis tools. It presents financial information in a standardized format, and the financial analysis tool is handy in two ways: vertical and horizontal analysis.
Vertical analysis analyzes every line item of a financial statement within the same financial period. Alternatively, horizontal analysis lets you view trends over time by comparing information from two or more periods. It is helpful in understanding how your business is performing through the years or against other competitors.
To use the common size analysis, you must prepare your financial statements first. The goal is to compare the numbers in an absolute format. The globally accepted format for disclosing financial information is in percentage. To achieve this, you need to derive the “percentage of base” from your financial statement, the formula is as follows:

For instance, if you want to analyze your balance sheet, you can consider the total assets as the base item. Divide every individual item under assets by the total assets then multiply by 100 to get the percentage. Similarly, you can use the total liabilities and shareholder’s equity as the base for every line within that category.
See the example below from Corporate Finance Insitute:
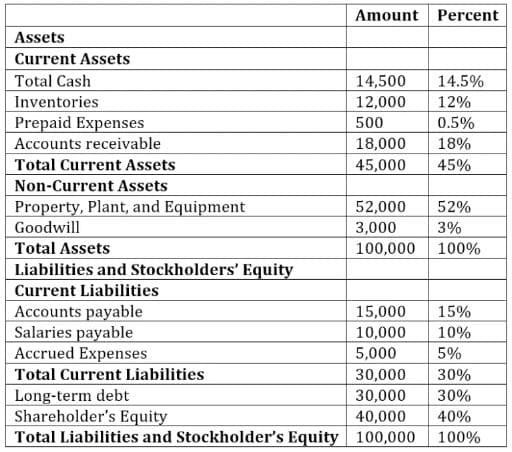
You may use the following base items for other financial statements:
- Income statement – Net sales
- Cash flow statement – Total cash flow
Since the information are presented in percentage format, users can easily see drastic changes in the financial statements. If you see big changes between reporting periods or to industry benchmarks, you dig in to see what caused the change and if any action is warranted.
Comparative Financial Statements
Comparative financial statements are financial analysis tools used primarily for horizontal analysis. This means the derived information from this allows users to analyze the periodic changes in items within the financial statements. Interested individuals can then determine which elements contribute the maximum impact.
Like the common size statement, you can present the information in comparative financial statements in percentage terms. The solution to calculate the %YoY Change between line items in two different financial periods is as follows:
To perform a comparative financial statement, prepare two successive financial statements. For example, your income statement for F.Y. 2020 and F.Y. 2021. Line all items up side by side, and then perform the equation. The most recent year is treated as the current year while the previous financial period will be your base year.
The %YoY change will reveal how much change was observed between the two accounting periods. Using comparative financial statements is advantageous because you can compare revenues and expenses, assets, and liabilities, spotting trends or spikes easily. Therefore, evaluating performance period after period becomes easy.
Note, using such financial analysis tools ignores inflationary impacts that may affect the numbers. Moreover, the %YoY change is easily affected by the method of accounting employed by businesses (cash method or accrual method).
 Ratio Analysis
 Ratio Analysis
Among the financial analysis tools, ratio analysis is the most commonly used by experts, market analysts, and other stakeholders. This financial tool is a quantitative method that enables users to gain insight on a company’s core qualities. This includes profitability, liquidity, and operational efficiency.
Ratio analysis sorts different kinds of ratios into six silos:
- Profitability Ratio
Profitability ratios measure how well a business produces profits from its operations. For example, for an HVAC contractor, the primary operations include installing, repairing, and maintaining HVAC units.
Profitability ratios under this silo include:
-
- Profit margin
- Gross margin ratios
- Return on assets
- Return on equity
- Return on capital employed
- Liquidity Ratio
The liquidity ratio conveys a business’s ability to settle short-term debts before maturity. It accounts for the company’s quick assets or assets you can convert to cash within a year.
Liquidity ratios under this silo include:
-
- Current ratio
- Quick ratio
- Working capital ratio
- Solvency Ratio
A.k.a. Financial leverage ratio compares the debt levels of a business versus its assets, earnings and equity. It evaluates the ability of a company to survive and remain competitive in the long term.
Solvency ratios under this silo include:
-
- Debt-equity ratios
- Debt-assets ratios
- Interest coverage ratios
- Efficiency Ratio
Efficiency ratios measure a company’s efficiency in using assets and liabilities to generate sales and profits.
Efficiency ratios under this silo include:
-
- Turnover ratio
- Inventory turnover
- Days’ sales in inventory
- Coverage Ratio
This ratio analyzes a business’s ability to pay debt interests and other obligations related to the company’s debts.
Coverage ratios under this silo include
-
- Times interest earned ratio
- Debt-service coverage ratio
- Market Prospect Ratio
It is the most relevant ratio for investors. These ratios are used to analyze or measure a stock’s intrinsic value.
Market Prospect ratios under this silo include:
-
- Dividend yield
- P/E ratio
- Earnings Per Share (EPS)
- Dividend payout ratio
Ratio analysis depicts a business’s most vital metrics. Despite being one of the most used financial analysis tools, there are essential elements that ratio analysis doesn’t consider.
- The size of businesses. It influences the bargaining power and economies of scale of larger companies over smaller businesses.
- Contingent liabilities are the externally influenced occurrences that may occur in the future, like lawsuits or availing of warranties.
- Non-standardized for industry comparison. Various companies may have different accounting methodologies. Therefore, comparing companies that use other accounting policies will deem inaccurate.
- Susceptibility to creative accounting. Accounting experts may manipulate information to make their ratio analysis more attractive to stakeholders.
- Too historically dependent. Ratio analysis follows the principle history repeats itself, which may be irrelevant if businesses revamp their business models.
- Doesn’t consider external uncontrollable factors. For example, inflation and market conditions are not considered in ratio analysis. Moreover, the effect of seasonality is also overlooked. In the HVAC industry, a spike in inventory costs due to supply chain issues is out of the control of the business owner.
Benchmarking Analysis
 Benchmarking Analysis
Benchmarking analysis compares the actual data from the forecasted targets developed by the top management. Think of it resembling a company’s performance to the “best practices” performers within the same industry. You are benchmarking to replicate the same best practices within your business or industry.
Benchmarking is done through the following steps:
- Find the area that needs to be streamlined or optimized
- Identify the points for comparison
- Create an improved standard compared to the benchmark
- Identify trigger points and evaluate the periodic performance
- Check whether the same performance is achieved
- If achieved, set up another benchmark
Benchmarking is a tool for improvement that may cover customer-facing activities or other internally driven needs. You use industry standards as the benchmark to learn how your business can surpass them. However, during benchmarking, companies simply need humility to accept that others are better at some things.
Financial Analysis Basics for Home Services Businesses
Many external factors and economies of scale favor household names over small home service businesses. That’s why extra effort must be put into monitoring and improving your financial situation to keep up with the times.
Ideally, small businesses must have the drive to analyze their finances weekly. A good grasp of financial health is linked to successfully growing and booming companies. Federal Reserve found that 92 percent of businesses with excellent financial health earned an annual income in excess of $1 million. Conversely, companies with bad financial standing had net income below the $100,000 mark.
That said, your financials are a portal to your business success. Financial analysis tools can help optimize your processes that make your business competitive in the residential home service industry.
If you need expert financial guidance, Rayn Chute at Wizard of Sales® is the man for the job. Book a call.